In recent years I have designed and taught courses and workshops for journalists and media professionals who work with data.
Through real examples from the media and interactive exercises, these workshops develop a critical eye toward statistics and offer practical tools for communicating quantitative information honestly and effectively. Four central ideas run through every session: chance as a legitimate explanation for patterns in data; the difference between correlation and causation; the quality and origin of data before turning them into stories; and statistics as summaries — useful or useless depending on what they are built to measure.
What these workshops cover
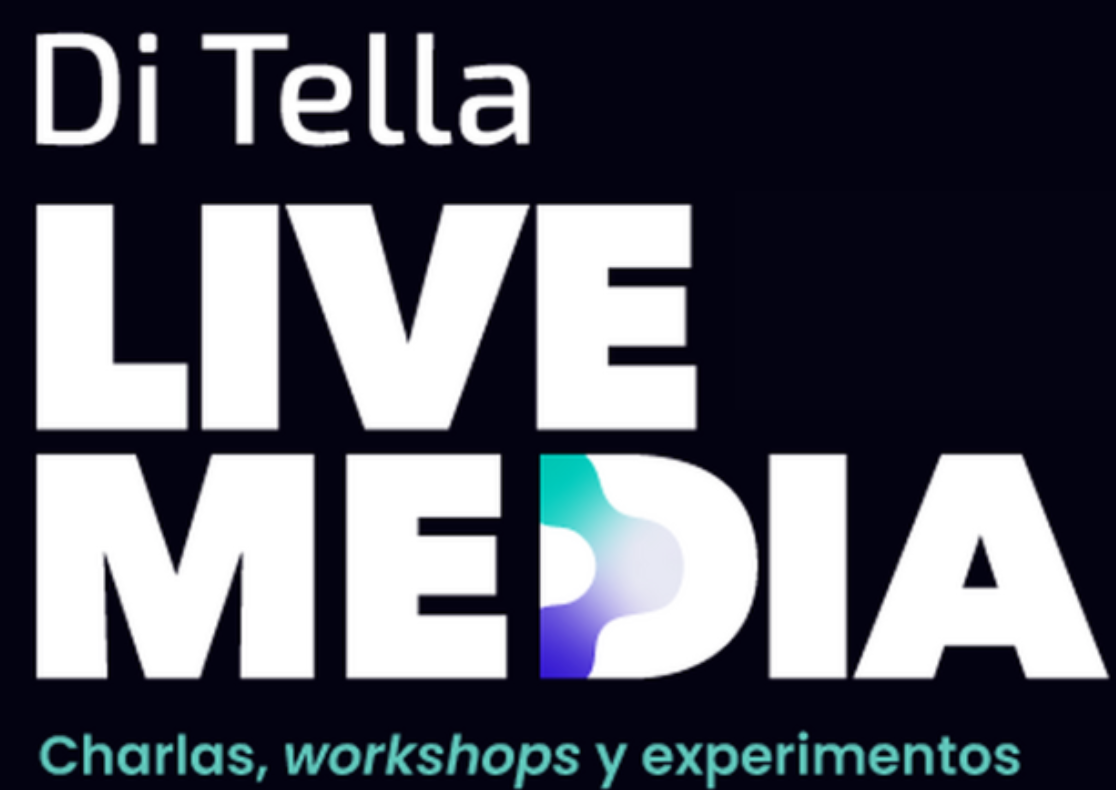
1
Chance as an explanation
Our brains are pattern-finding machines. A key question is: what would we expect if this were just luck?
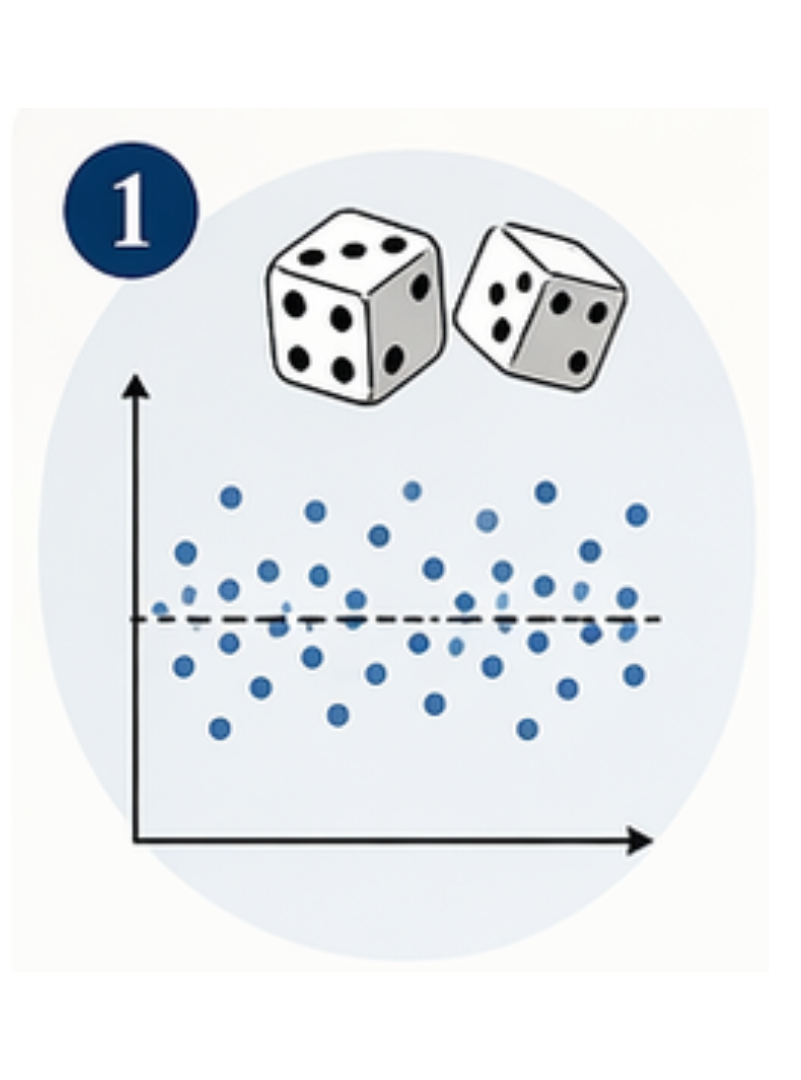
2
Correlation vs. causation
Two things moving together doesn’t mean one causes the other. How to spot the difference and use the right language.
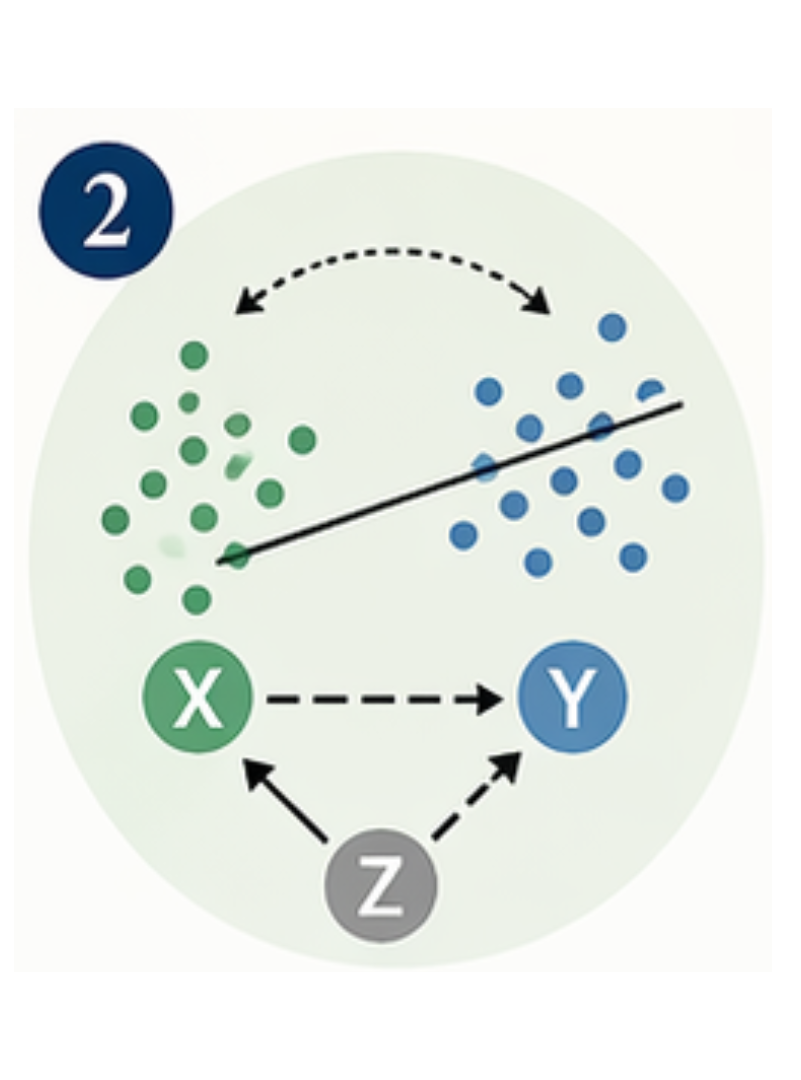
3
Data quality
Where do the numbers come from? Who collected them, how, and for what purpose? The origin of data is the first thing to check.
4
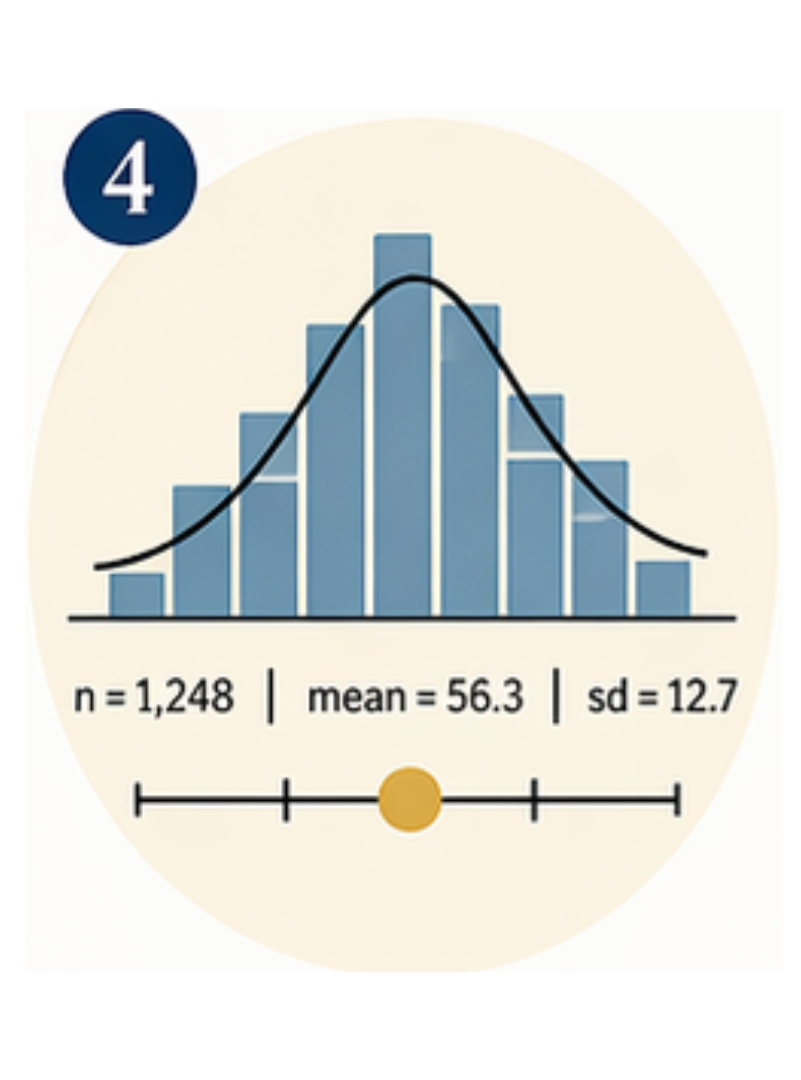
Statistics as summaries
Every statistic is a compression of reality. The question is whether that compression is useful for the story you’re telling.